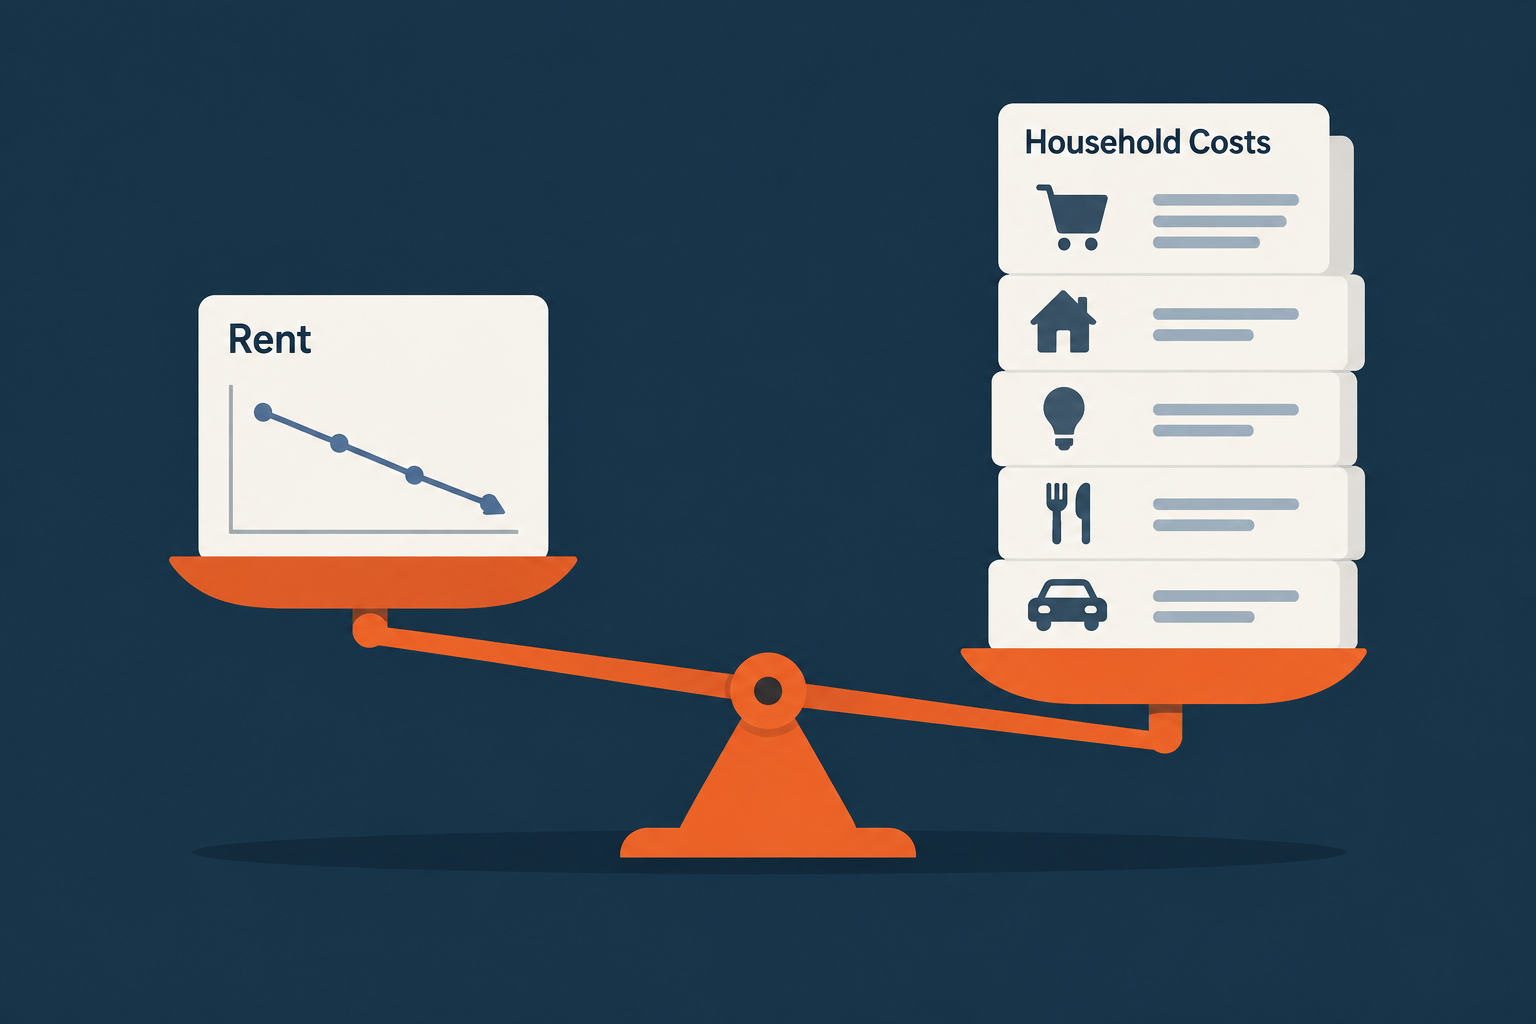
No, falling rent growth will not save you: rents are still up 30% in inflation-adjusted terms since 2001 while renter incomes rose about 9%, and roughly 22.7 million renter households — about half of all renters — spend more than 30% of income on housing. Near-zero national rent growth since mid-2023 slowed the bleeding. It did not close a 21-point affordability gap that took two decades to open.
I have been buying and operating real estate for 18-plus years, short-term rentals since 2016, and I have trained more than 10,000 operators. Every cycle produces the same headline reflex: rents cool, everyone relaxes, and the people who were about to act decide to wait one more quarter. The Harvard Joint Center for Housing Studies data says the waiting math is worse than the acting math.
The Headline Everyone Misread
Harvard's America's Rental Housing work reports that national rent growth has hovered near zero since mid-2023. That is real, and in a handful of Sun Belt metros with heavy 2021–2022 delivery pipelines, asking rents have actually fallen.
Here is the part that does not make the headline. Since 2001, rents climbed roughly 30% after inflation. Renter incomes climbed roughly 9%. A single flat year against a 21-point gap changes almost nothing for the household writing the check. Nearly 22.7 million renter households are cost-burdened at the 30% threshold, and more than half of those are severely burdened, handing over 50% or more of income just to keep a roof overhead.
Chris Herbert, Managing Director of the Harvard Joint Center for Housing Studies, put it plainly: despite the slow pace of rent growth in the near term, unaffordability will remain a major challenge for renter households.
Softening does not mean affordable. Softening means the rate of increase fell while the level stayed high. For an operator, the level is what sets your rent roll, and the level is not retreating.
Run the arithmetic yourself
Take a renter earning $52,000 a year, or $4,333 a month. The 30% burden line sits at $1,300 a month. A $1,750 unit puts that household at 40.4% of gross income. If rent growth is 0% next year and their pay rises 3%, they land at 39.2%. Still deep in burden territory. That is the whole story of the last three years in one calculation, and it is why "rents are dropping" is not a rescue.
The For-Sale Market Has Frozen
While renters absorb that gap, the for-sale market has gone quiet in a way I would describe as a psychological freeze. Cotality's April 2026 US Home Price Insights put home price growth at about 0.5% year over year in February 2026, the slowest pace in years. Mortgage rates sit near 6.38%. Foreclosure-related search interest jumped 13.4% in March to its highest level since March 2020. By most valuation models, roughly 70% of the top 100 metro areas still screen as overvalued.
Buyers are not buying. Sellers are not selling. Both sides are waiting for the other to blink, and transaction volume pays the price.
Danielle Hale, Chief Economist at Realtor.com, framed the risk this way: the worry heading into spring is that geopolitical tensions could cause history to repeat itself, sidelining both buyers and sellers and leaving the two sides too far apart to transact.
I have watched this before. I lost everything in the 2008 crash and started over from foreclosure with nothing. The people who waited for the right time are, many of them, still waiting. The people who underwrote carefully during uncertainty own the portfolios now. That is not motivation, it is observation.
Why Supply Is Not Coming to the Rescue
The clean fix for an affordability gap is more units. That fix is arriving slowly. Multifamily construction starts fell from roughly 550,000 units in 2022 to about 350,000 in 2024, recovering to roughly 415,000 in 2025. Construction materials costs for multifamily work are up more than 40% since 2020. The Census Bureau's new residential construction series is the place to watch this month by month rather than trusting a headline.
Meanwhile the bottom of the market keeps growing. Very-low-income renters who cannot afford market-rate housing rose from about 9.4 million households in 2003 to about 13.8 million in 2023. Assistance coverage slid from roughly 45% to under 40%, leaving on the order of 8.5 million households unassisted. HUD publishes the income limits and Fair Market Rents that define those thresholds, and they are worth reading before you assume a market is "too cheap" to work.
This table pulls the supply and demand numbers into one view so you can see why the gap persists even in a flat-rent year.
Measure | Earlier reading | Latest reading | Direction |
|---|
Multifamily starts | 550,000 (2022) | 415,000 (2025) | Down 24.5% |
Very-low-income renters | 9.4M (2003) | 13.8M (2023) | Up 46.8% |
Assistance coverage | ~45% | Under 40% | Down |
Real rent change since 2001 | — | +30% | Up |
Real renter income change since 2001 | — | +9% | Up, slower |
Fewer units delivered, more households priced out of ownership, and shrinking subsidy coverage add up to durable rental demand. That demand does not evaporate because a rent index printed 0.2% instead of 6%.
What the Freeze Does to Your Acquisition Math
A frozen market is not a bad market for a buyer with a spreadsheet. It is a bad market for a buyer with a story. When fewer people transact, sellers who must move — estate sales, tired landlords, failed flips, owners staring at a balloon payment — negotiate against a thin bidder pool instead of twelve offers.
Short-term rental revenue changes the comparison further. A unit that leases long-term at $1,750 might gross $3,400 a month at 62% occupancy on a $180 average daily rate, and carry $1,300 of cleaning, supplies, software, and platform costs. Here is that comparison written out so the tradeoff is visible rather than assumed.
Line item | Long-term rental | Short-term rental |
|---|
Monthly gross revenue | $1,750 | $3,400 |
Operating costs (ex-debt) | $250 | $1,300 |
Net before debt service | $1,500 | $2,100 |
Income concentration | 1 tenant | ~7 stays/month |
Turn risk if one payer fails | 100% of rent | ~14% of month |
Those figures are an illustrative example at stated assumptions, not a market forecast. Change the ADR to $140 and occupancy to 50% and the short-term column grosses $2,100 and nets $800, below the long-term line. The point is not that short-term always wins. The point is that the decision is arithmetic, and the arithmetic still works in a flat-rent year when you buy right.
A Market Screening Process You Can Run This Week
The first move is not buying a property. It is proving or killing one market with numbers. Give it an afternoon.
Pick one zip code you can drive to, or fly to twice a year without resentment.
Pull the HUD Fair Market Rent for that county and the two-bedroom figure specifically. That is your long-term rent floor.
Pull rental vacancy and homeownership rates for the metro from the Census Housing Vacancies and Homeownership survey. Vacancy above the national rate means you are competing on price.
Pull 12 months of AirDNA or comparable data for three-to-six close comps. Record ADR and occupancy separately, never as a blended revenue number.
Build the cost stack: cleaning per turn, supplies, utilities, insurance, software, platform fees, permit cost, and a 5% maintenance reserve.
Underwrite at 80% of the comp revenue and 110% of the cost stack. If it still clears debt service by 15%, the market is a candidate.
Call the city or county about permits before you write an offer. A ban proposal in committee kills more deals than a bad ADR ever will.
Repeat in a second zip code so you have a comparison, not a conviction.
Eight steps, zero dollars committed. Most people skip step seven and learn the regulation answer after closing.
Failure Modes I See Most Often
Blended revenue estimates. A tool reporting $4,100 monthly revenue may be averaging a lakefront five-bedroom with your one-bedroom condo. Pull ADR and occupancy separately and rebuild the number yourself.
Rate speculation as a strategy. Waiting for a specific mortgage rate means competing with everyone else watching the same number. When rates drop a point, the bidder pool triples and the discount you were waiting for disappears into the price.
Ignoring the burden data. If half the renters in your submarket are cost-burdened, a mid-tier long-term unit faces payment risk your model probably does not price. Short-term and mid-term stays spread that risk across many payers instead of one.
Under-reserving. Furnishings, appliances, and hot tubs fail on their own schedule. I hold 5% of gross for maintenance and another 3% for furniture replacement. Operators who skip that line fund repairs from next month's bookings and never catch up.
Buying a city instead of a street. Regulation, parking, HOA rules, and noise ordinances are block-level facts. Metro averages tell you almost nothing about whether your specific unit can legally host guests in eighteen months.
Where to Point Your Next 90 Days
If you own units already, pull your trailing twelve months and calculate what share of revenue came from your top three months. Anything above 45% means your model depends on a season, and a soft year hurts more than the average suggests. Fix that with mid-term stays, corporate placements, or repositioning before you add doors.
If you do not own yet, finish the screening process above on two zip codes and price one deal properly. A frozen market gives you time to be slow and exact, which is the opposite of what a bidding war gives you.
If you want a second set of eyes on your numbers, book a complimentary one-on-one diagnostic call at cashflowdiary.com/diagnostic. The call itself is free. If we build you a written action plan afterward, that plan is $997, and you will know that before anything is charged.
Flat rent growth is not relief. It is a pause in a long trend that has already pushed 22.7 million households past the point where the numbers work. Operators who underwrite that reality own the units those households will rent for the next decade.
Frequently Asked Questions
Is rent actually getting cheaper in 2026?
Not in a way most renters feel. National rent growth is near zero, but that follows roughly 30% of inflation-adjusted increases since 2001 against 9% income growth. A flat year holds the level in place instead of lowering it. About 22.7 million renter households still pay more than 30% of income for housing.
What does the Harvard rental housing report mean for investors?
It documents structural demand that survives market cycles. Cost-burdened households do not stop needing housing, and the supply pipeline is delivering fewer units than 2022. For operators, that means occupancy risk is lower than headlines imply and pricing power at the affordable end is sturdier than at the luxury end.
Should I wait for mortgage rates to drop before buying a rental?
Rates near 6.38% are not obviously falling soon, and waiting for a target rate puts you in line with every other buyer watching the same number. When rates fall, competition rises and prices absorb the savings. Underwrite to cash flow at today's rate and treat any future refinance as upside, not as the plan.
How do I tell a soft market from a broken one?
Look at rental vacancy, permit trends, and employment concentration together. A soft market has flat rents with stable vacancy and diversified employers. A broken market has rising vacancy, falling permits, and one industry carrying payroll. The Census vacancy and construction series make that check quick.
Is a short-term rental safer than a long-term rental in a downturn?
Safer is the wrong frame; the risks differ. A long-term unit concentrates 100% of income in one payer, and a short-term unit spreads it across roughly seven stays a month but carries higher operating costs and regulatory exposure. Short-term wins when ADR and occupancy hold above your cost stack, and loses quickly when they do not.
What is the smallest first step that still counts?
Run the eight-step screening process on one zip code and write the number down. It costs nothing, takes an afternoon, and produces a decision you can defend. Most people who stall are not short on capital, they are short on one completed underwriting exercise.
Sources
Related Reading