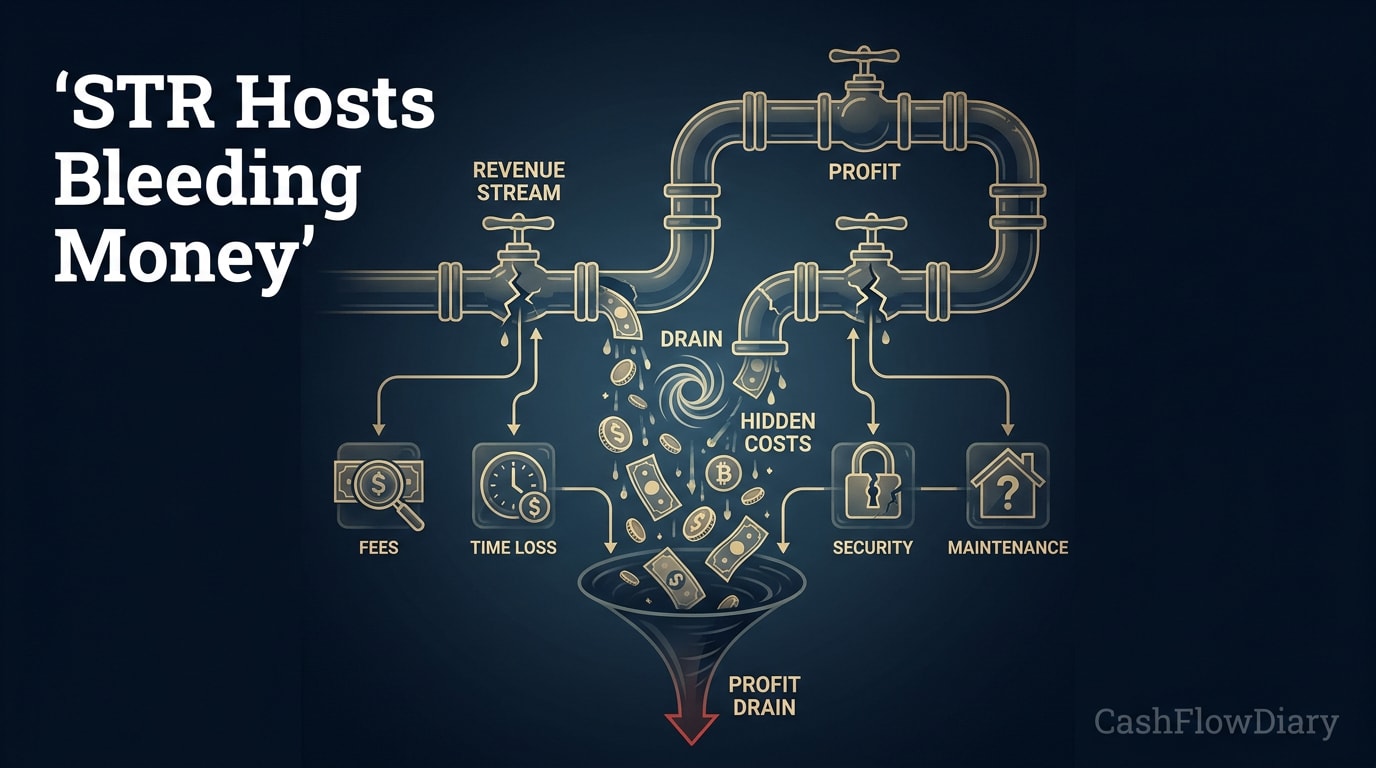
Most STR hosts bleed money without noticing because they judge the business by gross bookings instead of net cash flow. In the worked example below, a listing that books $6,500 a month keeps $1,495 after eight expense lines, so 77% of every booking dollar is gone before the owner sees any of it. Add a 15.5% Airbnb single-fee host charge that is not on that expense list, and the $1,495 drops to $487.50.
I have been in real estate for more than 18 years and focused on short-term rentals since 2016. After training more than 10,000 operators, the pattern I see most often is bad arithmetic: the wrong denominator, the wrong unit, or a missing line. None of it takes advanced math. It takes the discipline to write every number down and check it. The examples in this article are illustrative models unless I say otherwise, and every figure is shown with its math so you can rerun it with your own numbers.
Gross Revenue Is Not Profit: The $6,500 Month
Here is the first mistake. A host buys a $350,000 property, books $6,500 a month, and multiplies by 12 to get $78,000 a year. Divide $78,000 by $350,000 and you get 22.3%. That number goes on social media as "22% ROI."
That figure is a gross yield. It says nothing about what the owner keeps. The owner put down 20%, or $70,000, and financed the rest. To know what that $70,000 is earning, you have to subtract every monthly cost from the $6,500.
This is the monthly expense stack for the same listing, using round illustrative numbers:
Monthly line item | Amount |
|---|
Mortgage payment | $1,890 |
Insurance | $350 |
Property tax | $580 |
Maintenance | $650 |
Management (7% of $6,500) | $455 |
Utilities | $180 |
Cleaning | $780 |
Supplies | $120 |
Total expenses | $5,005 |
$6,500 minus $5,005 leaves $1,495 a month, or $17,940 a year. Divide $17,940 by the $70,000 actually invested and the cash-on-cash return is 25.6%.
In this version of the deal, the real return is better than the social-media number. That is the part hosts like to hear. The part they skip is the line that is missing from the table: the platform fee.
Airbnb publishes two host fee structures. Under split-fee, most hosts pay a 3% host service fee. Under the single-fee structure, which Airbnb says is mandatory for most hosts, the whole fee comes out of the host payout, and most hosts pay 15.5%. On a $6,500 booking month, 3% is $195 and 15.5% is $1,007.50. At 15.5%, monthly cash flow falls from $1,495 to $487.50, annual cash flow falls to $5,850, and the cash-on-cash return falls from 25.6% to 8.4%.
Same house, same bookings. One missing line moved the return by more than 17 points. That is what bleeding money without knowing it looks like: a host who is sure the property clears $1,495 when the bank account says $487.50.
The IRS treats most of these lines as deductible rental expenses, including mortgage interest (not the principal part of the payment), real estate taxes, maintenance, utilities, insurance, and depreciation. That matters for taxes. It does not make the cash come back. Track the cash first, then let your tax preparer handle the deductions.
A $64,000 Contract Shows How One Misread Line Compounds
I learned to respect this kind of error in a contract negotiation, not on a rental. The deal was a $64,000 obligation with a $10,000 down payment, 7% APR, a 54-month term, and full amortization. The other party sent paperwork saying I owed $72,740.98.
Their number was wrong, and the error was simple. They started from the full $64,000 as principal and never credited the $10,000 I had already paid. The correct principal was $54,000. Amortized at 7% APR over 54 months, that is a payment of $1,168.65 a month.
The comparison below puts their paperwork next to the amortization math:
Line | Their paperwork | Correct amortization |
|---|
Principal financed | $64,000.00 | $54,000.00 |
Interest over the term | $8,740.98 | $9,106.83 |
Monthly payment | Not stated | $1,168.65 |
Total still owed | $72,740.98 | $63,106.83 |
The gap is $9,634.15. Look at how it breaks down: $10,000 of uncredited down payment, offset by $365.85 because their interest figure was actually too low. Two errors in opposite directions, netting to a number that looked plausible on paper.
STR hosts do the same thing when they treat total potential income as profit or skip a fee line. The number looks close enough, nobody reruns it, and the error repeats every month. The fix is the same in both cases: rebuild the number from the source terms instead of trusting the summary.
ROI vs. Cash-on-Cash: Pick the Right Denominator
The second mistake is dividing by the wrong number. Return on the property's price and return on your cash are different questions, and hosts mix them constantly.
Take a $300,000 purchase with 20% down. The host puts in $60,000 and finances $240,000. Gross revenue is $45,000 a year. Many hosts divide $45,000 by $300,000 and call it a 15% ROI. But with $28,000 in annual expenses, net cash flow is $17,000. Divide $17,000 by the $60,000 invested and the cash-on-cash return is 28.3%.
Now a $400,000 property with $80,000 down and $22,400 in annual cash flow. $22,400 divided by $80,000 is 28%. $22,400 divided by $400,000 is 5.6%. At 28% you keep the property. At 5.6% you start wondering if an index fund would have been easier. Same cash, different denominator, opposite decision.
Here are all three deals side by side, price-based figure against cash-on-cash:
Deal | Cash invested | Annual net cash flow | Price-based figure | Cash-on-cash return |
|---|
$300,000 purchase | $60,000 | $17,000 | 15% ($45,000 ÷ $300,000) | 28.3% |
$350,000 purchase, before platform fee | $70,000 | $17,940 | 22.3% ($78,000 ÷ $350,000) | 25.6% |
$400,000 purchase | $80,000 | $22,400 | 5.6% ($22,400 ÷ $400,000) | 28% |
Use cash-on-cash to compare deals that use your cash. Use price-based figures only to compare properties against each other before financing. Never compare one to the other.
The Six-Skill STR Math Checklist
These are the six calculations I ask every operator to run on their own listing before we talk about growth. Work through them in order. Each one feeds the next.
Measure occupancy in nights, not bookings. Occupancy is occupied nights divided by available nights. A host with 15 bookings in a 30-night month who divides 15 by 30 reports 50%. If those stays covered 21 nights, true occupancy is 21 ÷ 30 = 70%. At $150 a night, the bookings-based figure implies $2,250 in revenue while the nights-based figure is $3,150, a $900 monthly difference in what you think you earned.
Calculate marketing cost per guest night. Divide monthly marketing spend by bookings, then by average stay length. $1,200 in spend across 8 bookings is $150 per booking. At an average stay of 3.2 nights, that is $46.88 per guest night. On a $180 nightly rate, you have $133.12 left before cleaning, fees, and fixed costs. Hosts who count the full $180 as margin are overstating it by $46.88 a night.
Set a floor rate from fixed costs. Divide monthly fixed costs by expected occupied nights. With $3,500 in fixed costs and 21 occupied nights, the break-even rate is $166.67 a night. A 30% markup gives $166.67 × 1.30 = $216.67. Note that a 30% markup is a 23% margin, because $50 of profit on a $216.67 rate is 23%. Then adjust by season: $216.67 × 1.50 = $325.00 in peak weeks and $216.67 × 0.80 = $173.33 off-season. That off-season rate still clears the $166.67 floor, which is the point of this demand-based pricing math.
Report cash-on-cash return, not gross yield. Annual net cash flow divided by cash invested. Use the table above as the template.
Project cash flow growth with the compound formula. Future value equals present value × (1 + growth rate) raised to the number of years of growth. If $22,400 of year-one cash flow grows 15% a year, year two is $22,400 × 1.15 = $25,760. Year five has four years of growth, so it is $22,400 × 1.15⁴ = $39,178, or about $3,265 a month. The 15% is an assumption you must earn with reinvestment, not a forecast.
Run the hold-versus-sell comparison. A property worth $450,000 produces $25,000 a year. If selling nets $405,000 after costs, holding earns $25,000 ÷ $405,000 = 6.17% on the money you could pull out. If you could place $405,000 at an assumed 8%, it would produce $32,400, or $7,400 more a year. That comparison is before taxes and appreciation, so run it with your CPA before acting on it.
Six Months of Numbers: A 3BR Illustrative Model
To show how these pieces fit, here is a model of a 3BR/2BA purchased for $420,000 with $84,000 down. The $336,000 loan at 6.5% over 30 years carries a monthly payment of $2,124. The listing rents at $300 a night. Expenses are $3,654 a month in fixed costs, including the mortgage, plus $51 in variable cost per occupied night.
The six-month run below uses those inputs:
Month | Nights | Revenue | Expenses | Cash flow |
|---|
Month 1 | 24 | $7,200 | $4,878 | $2,322 |
Month 2 | 23 | $6,900 | $4,827 | $2,073 |
Month 3 | 27 | $8,100 | $5,031 | $3,069 |
Month 4 | 25 | $7,500 | $4,929 | $2,571 |
Month 5 | 26 | $7,800 | $4,980 | $2,820 |
Month 6 | 28 | $8,400 | $5,082 | $3,318 |
Total | 153 | $45,900 | $29,727 | $16,173 |
Average monthly cash flow is $2,695.50. Annualized, that is $32,346, and $32,346 divided by $84,000 is a 38.5% cash-on-cash return.
The host who reads this wrong says, "I made $45,900," and divides by $420,000 to get 10.9%, which is also comparing six months of revenue to a full purchase price. That host concludes the property underperforms. The host who reads it right knows three things the first host does not:
Break-even occupancy: each night contributes $300 minus $51, or $249. $3,654 ÷ $249 = 14.7 nights a month to cover fixed costs.
Cushion: the slowest month, at 23 nights, sits more than 8 nights above break-even.
Real return: 38.5% on cash, before any platform fee is added. If this listing moves to a 15.5% single fee, rerun every row before you celebrate.
How to Stop the Bleed This Month
You do not need software to start. You need one afternoon and your last six months of payouts and bank statements.
Start with actual payouts, not booking totals, so platform fees are already out. List every recurring expense, including the ones paid annually, like insurance and property tax, divided by 12. Count occupied nights, not stays. Divide annual net cash flow by the cash you actually invested. Then compare your nightly rate to the break-even rate from step 3 of the checklist.
If any number surprises you, that is the leak. Fix the largest one first. In my experience it is usually a missing fee line, a cleaning cost that grew without a matching cleaning fee, or a rate set by feel below the fixed-cost floor.
If you want a second set of eyes on your numbers, book a complimentary one-on-one diagnostic call. The diagnostic is free. If you want a written plan afterward, the action plan is $997.
Frequently Asked Questions
Why do STR hosts think they are profitable when they are not?
Most hosts look at booking totals instead of net cash flow. In the $6,500 example, eight expense lines leave $1,495, and a 15.5% single-fee platform charge would cut that to $487.50. If you never subtract every line, the gap stays invisible.
What is the difference between ROI and cash-on-cash return?
Price-based ROI divides income by the property's value. Cash-on-cash divides annual net cash flow by the cash you invested. On the $400,000 example, the same $22,400 is 5.6% of price but 28% of the $80,000 down payment.
How should I calculate occupancy rate?
Divide occupied nights by available nights. Fifteen bookings covering 21 nights in a 30-night month is 70% occupancy, not 50%. Counting stays instead of nights understates occupancy and distorts every rate decision built on it.
How do I find my break-even nightly rate?
Divide monthly fixed costs by expected occupied nights. With $3,500 in fixed costs and 21 occupied nights, break-even is $166.67 a night. Price above that floor, then adjust up in peak demand and down in slow months without going below it.
Does Airbnb's host fee really change my return that much?
It can. Airbnb lists a 3% host fee for most split-fee hosts and 15.5% for most single-fee hosts. On $6,500 a month, that is $195 versus $1,007.50, which in the example moves cash-on-cash from 25.6% to 8.4% at the higher fee.
When does selling beat holding a short-term rental?
Compare what the property earns on the cash you could pull out against what that cash could earn elsewhere. In the example, $25,000 on $405,000 of net proceeds is 6.17%, while an assumed 8% would produce $32,400. Taxes and appreciation can change the answer, so run it with a CPA.
Sources
Airbnb service fees — supports the 3% split-fee and 15.5% single-fee host service fee figures in Gross Revenue Is Not Profit.
Topic no. 415, Renting residential and vacation property — supports the list of deductible rental expenses (mortgage interest, real estate taxes, maintenance, utilities, insurance, depreciation) in Gross Revenue Is Not Profit.
Publication 527 (2025), Residential Rental Property — supports the treatment of rental income, expenses, and depreciation referenced in Gross Revenue Is Not Profit.
What is the difference between a mortgage interest rate and an APR? — explains APR, the rate basis used in the $64,000 contract section.
Compound Interest Calculator — supports the compound growth formula used for the $39,178 year-five projection in The Six-Skill STR Math Checklist.
Related Reading