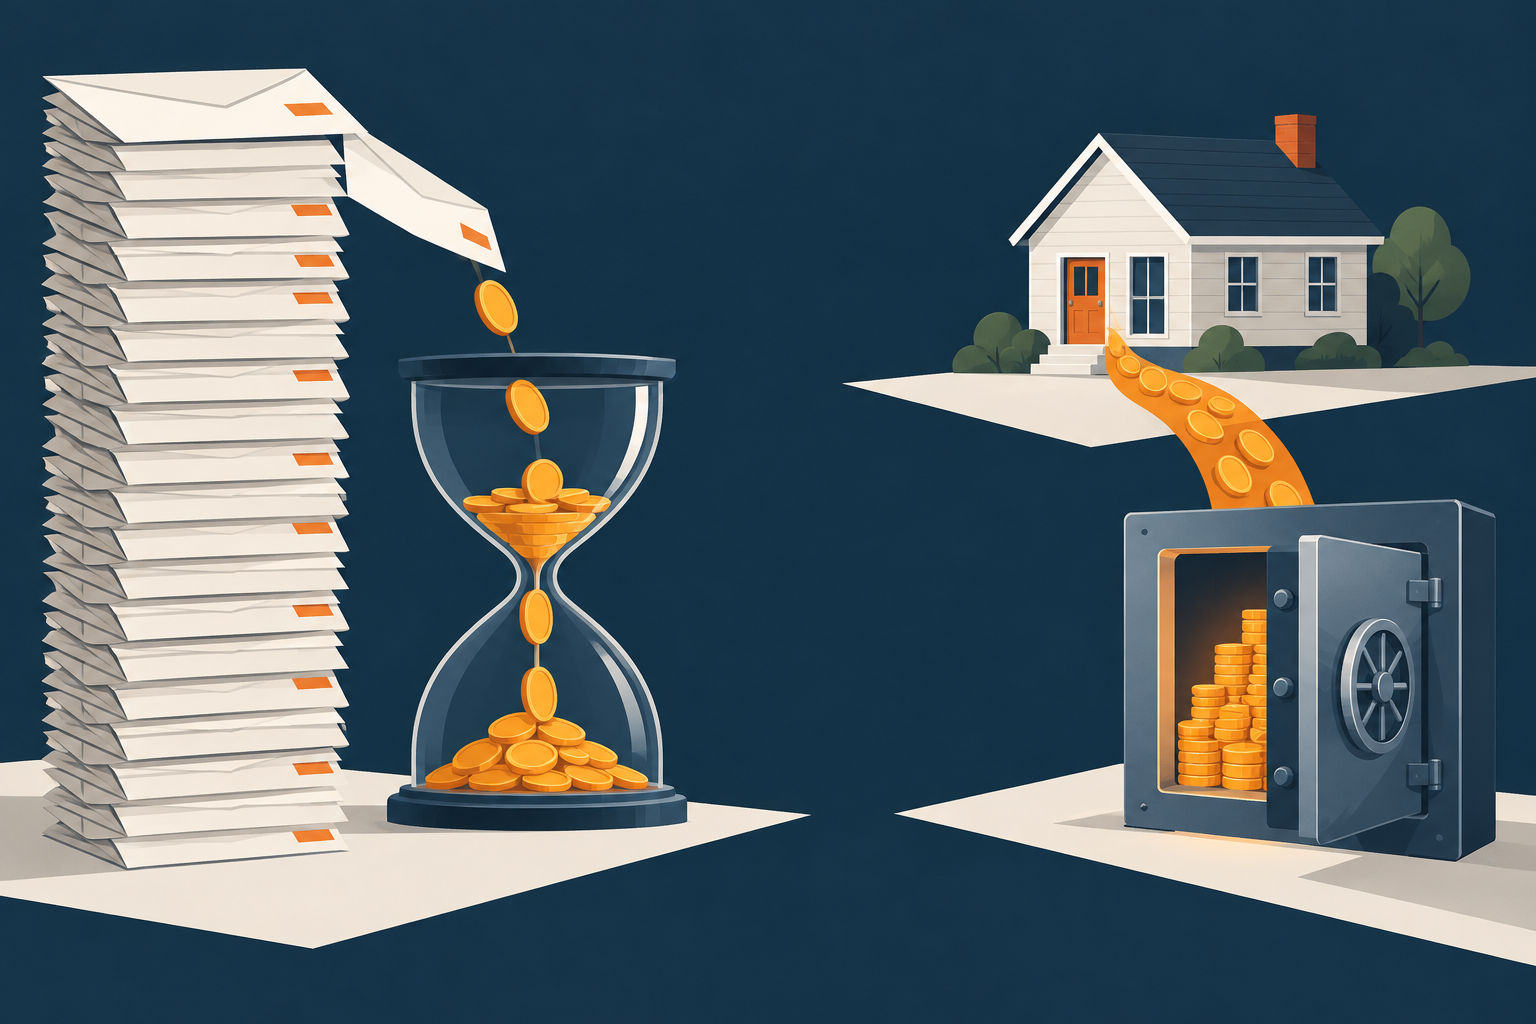
High income fails to become wealth when spending rises with every raise, because wealth is measured by how many months your money lasts without new labor, not by how much arrives each year. In the Federal Reserve's 2025 survey of household finances, only 59% of non-retirees with family income of $100,000 or more said their retirement savings were on track, even though 89% of that group had a tax-preferred retirement account such as a 401(k) or IRA.
That gap between earning and owning is what this article is about. I have spent more than 18 years in real estate and have run short-term rentals since 2016, and the pattern I see most often in people who come to me is not low income. It is high income with a short runway. A surgeon, a sales director, or a two-income tech household can earn several times the national median and still be three missed paychecks away from a crisis.
Below is the math: how to measure runway, why the retirement replacement gap is widest for high earners, how savings rate beats salary, and where an income-producing asset like a short-term rental fits, with the conditions and risks that come with it.
Income Measures Speed; Wealth Measures Runway
The cleanest definition I use is this: income is how fast money arrives, and wealth is how long it lasts once you stop trading hours for it. Two households can have the same paycheck and completely different wealth, because one of them has built something that pays whether or not anyone shows up to work.
I cover the full "rich is speed, wealthy is time" framework, including the three-person example, in The Transformation Trap. Here I want to put a number on it, because a number is harder to argue with than a slogan.
Runway is simple:
Runway (in months) = money and asset income you can live on ÷ monthly spending
A household with $60,000 in accessible savings and $10,000 a month in spending has six months of runway. A household with $300,000 in savings and $30,000 a month in spending has ten months. The second household looks five times richer on paper. It is less than twice as free.
The other half of runway is income that does not depend on your labor. If an asset pays $2,000 a month and you spend $10,000, that asset covers 20% of your life indefinitely. Stack enough of those and runway stops being a countdown.
This is why a raise often changes nothing. If a $40,000 raise brings $40,000 of new spending, the paycheck got faster and the runway stayed exactly where it was.
What the Federal Reserve Data Shows About High Earners
The Federal Reserve's Survey of Household Economics and Decisionmaking (SHED) for 2025, published in May 2026, asks non-retired adults whether they have retirement accounts and whether they think their retirement saving is on track. The income breakdown is where it gets interesting.
The table below is taken directly from the Fed's retirement-preparedness table for non-retirees (all figures are percent of each group):
Family income | Have tax-preferred retirement account | Have defined benefit pension | Say retirement savings on track |
|---|
Less than $25,000 | 15% | 3% | 7% |
$25,000–$49,999 | 38% | 9% | 16% |
$50,000–$99,999 | 65% | 21% | 29% |
$100,000 or more | 89% | 33% | 59% |
All non-retirees | 61% | 21% | 35% |
Two things stand out. First, higher income clearly helps: the on-track share climbs with every bracket. Second, the top bracket still has a 30-point gap between people who hold a retirement account (89%) and people who think it is enough (59%). Owning a retirement account and being on track are not the same thing.
The broader numbers from the same report are sobering. In 2025, 63% of all adults said they would cover a surprise $400 expense with cash or its equivalent, and 55% said they had set aside three months of expenses in a rainy day fund. Only 11% of adults reported owning a business or real estate as an asset. Meanwhile 73% described themselves as "doing okay" or "living comfortably." Feeling fine and having runway are different measurements.
For context on what "high income" means, the Census Bureau reports that median household income in the United States was $83,730 in 2024. A household at $100,000 or more is above the middle of the country, which is exactly why a 59% on-track rate in that group matters.
The Retirement Replacement Gap Hits High Earners Hardest
Social Security was designed to replace part of a worker's earnings, not all of it. It only counts wages up to an annual taxable maximum, and its benefit formula replaces a larger share of lower earnings than of higher earnings. The practical result: the more you earn, the smaller the share of your paycheck Social Security replaces. Pull your own estimate from your online my Social Security account at ssa.gov before you plan anything; do not use a rule of thumb from a blog post, including this one.
Here is an illustrative example of how the gap forms. These are assumptions, not predictions.
A household earns $250,000 and spends $180,000 a year before retirement.
Assume Social Security and any pension together provide $60,000 a year.
The gap is $180,000 minus $60,000, or $120,000 a year.
If you assume a 4% annual draw from savings, closing that gap needs $120,000 ÷ 0.04 = $3,000,000 invested.
Now compare that with what disciplined saving produces. The IRS elective deferral limit for a 401(k) is $24,500 in 2026. If one earner contributed $24,500 every year for 25 years and earned an assumed 6% a year, the SEC's Investor.gov compound interest calculator math gives about $1,344,181. At the same 4% draw, that supports about $53,767 a year.
That leaves roughly $66,233 a year still uncovered ($120,000 minus $53,767). Employer matches, a spouse's plan, taxable brokerage accounts, and home equity can close some of it. But the example shows why a maxed-out 401(k) alone rarely funds a high-income lifestyle. The bigger the lifestyle, the bigger the number you have to replace, and the smaller the share that Social Security carries.
The gap has two fixes, and you can use both: lower the spending you need to replace, or add income that does not come from your labor.
Savings-Rate Math: Why Spending Decides More Than Salary
Your savings rate controls two things at once. It sets how much you put away each year, and it sets how much life each dollar has to cover. That second effect is the one high earners miss.
If you save a share of income called s, each year of work buys s ÷ (1 − s) years of your current lifestyle. The table below shows that arithmetic at common savings rates. It holds at any income level because it is a ratio.
Savings rate | Years of spending bought per year worked | Months of runway added per year worked |
|---|
5% | 0.05 | 0.6 |
10% | 0.11 | 1.3 |
20% | 0.25 | 3.0 |
30% | 0.43 | 5.1 |
50% | 1.00 | 12.0 |
Put two households side by side:
Household A earns $300,000 and saves 5%. It saves $15,000 and spends $285,000. Each year of work buys about 0.6 months of its lifestyle.
Household B earns $83,730, the 2024 Census median, and saves 25%. It saves $20,932.50 and spends $62,797.50. Each year of work buys four months of its lifestyle.
Household A earns more than three and a half times as much. Household B builds runway more than six times as fast. Salary sets the ceiling; spending decides whether you get anywhere near it.
This is also why cutting a $1,500 monthly car payment can matter more than a promotion. A $50,000 car costs 1,250 hours of work at $40 an hour ($50,000 ÷ $40), which is about 31 weeks of full-time labor before taxes. Every dollar of fixed spending is a claim on future hours.
Where an Income-Producing Asset Fits
Savings rate builds the pile. Assets change the denominator, because they pay part of your spending without new hours. In my world that asset is usually a short-term rental, and I want to be precise about what it can and cannot do.
Here is illustrative math:
Suppose one well-run unit nets $800 a month after rent or mortgage, cleaning, supplies, platform fees, and utilities. That is $9,600 a year.
Six such units net $57,600 a year. Against Household B's $62,797.50 of spending, that covers about 11 months of its year.
Twelve such units net $9,600 a month, or $115,200 a year.
Those are round, illustrative numbers. Real units vary widely by market, season, and lease terms, and many units net less than $800, especially in the first year. Rental income is also taxable; the IRS rules for residential and short-term rental property sit in Publication 527, and you should plan taxes with a professional before you count net income as spendable.
What an operator learns quickly is that a rental is a business, not a savings account. The first units take real labor: sourcing, furnishing, pricing, guest messaging, cleaner scheduling, and handling problems at 11 p.m. It only starts to behave like runway when the operation runs on systems and people other than you. Until then, you have bought yourself a second job.
The risks are specific, and any one of them can end a portfolio:
Regulation. City permit rules and HOA or landlord restrictions can shut a unit down with little notice.
Concentration. One market, one platform, or one landlord is a single point of failure.
Thin margins. A few slow months or a pricing mistake can erase a year of net income.
Debt. Financing furniture or startup costs on high-interest credit turns a slow season into a crisis.
If you are still employed and want the version of this that starts with one asset on nights and weekends, read Why Your Job Is Secretly Training You. If your constraint is credit or capital, How a 398 Credit Score and Zero Capital walks through non-bank routes and their risks.
The Wealth Runway Checklist: Steps for High Earners
This is the process I walk people through when their income is fine but their runway is not. Do it in order; the later steps depend on the earlier numbers.
Calculate your runway today. Add up cash and accessible savings, then divide by your real monthly spending from the last three months of statements, not a budget you wish you followed.
Find your true savings rate. Divide what you actually saved and invested last year by gross income. Compare it with the table above to see how many months of runway each working year is buying.
Estimate your replacement gap. Pull your Social Security estimate, list any pension, and subtract both from the annual spending you expect in retirement. Write down the gap as a yearly dollar figure.
Cut one fixed cost before adding any income. Pick the largest recurring payment you could drop or shrink, such as a vehicle, a subscription stack, or an oversized lease, and redirect it to savings the same month.
Build three months of spending in cash first. The Fed data shows 55% of adults have this cushion. Get into that group before you take any business risk.
Choose one income-producing asset and run the numbers conservatively. For a rental, model net income at a lower occupancy than the listing tools suggest, and include taxes, supplies, and replacement costs.
Review runway every quarter. Track months of runway and the share of spending covered by asset income. Those two numbers tell you more than your salary does.
If you want a second set of eyes on your numbers, book a complimentary one-on-one diagnostic call. The diagnostic is free. If it makes sense afterward, we can build a written $997 action plan, but you will leave the call with your runway and gap figures either way.
Failure Modes That Keep High Earners Stuck
After years of working with operators and would-be operators, the same failures keep showing up.
Lifestyle creep. Each raise brings a bigger house, a newer car, or private school, and the savings rate never moves. The fix is to decide in advance what share of every raise goes to savings before the first new paycheck lands.
Treating the retirement account as an emergency fund. The Fed's 2025 survey found that 5% of non-retirees borrowed from a retirement account in the prior year, 4% cashed out funds, and 8% reduced contributions; 14% did at least one of those. Among those who cashed out, only 24% still said their retirement savings were on track. A cash cushion protects the long-term account.
Buying an asset without a margin of safety. A unit that only works at peak occupancy is a bet, not an asset. Stress-test every deal at a slow season before you sign.
One asset, one market. A single rental, a single employer, or a single platform means one policy change can wipe out the income. Spread risk as soon as the first asset is stable.
Confusing feeling okay with being okay. Seventy-three percent of adults say they are doing okay financially, while only 35% of non-retirees think their retirement savings are on track. Run the runway math and trust the number over the feeling.
Frequently Asked Questions
Why do people with high incomes still struggle to build wealth?
Spending usually rises with income, so the savings rate stays flat and runway barely grows. In the Fed's 2025 survey, only 59% of non-retirees earning $100,000 or more said their retirement savings were on track. Wealth depends on how long money lasts without new labor, not on the size of the paycheck.
What is the difference between high income and wealth?
Income is how fast money arrives. Wealth is how many months you could maintain your lifestyle from savings and asset income if your paycheck stopped. A household earning $300,000 and saving 5% adds less than a month of runway per year worked.
How much of my income will Social Security replace?
It depends on your earnings history, and it replaces a smaller share of income for higher earners because it only counts wages up to an annual taxable maximum. Get your personal estimate from your online my Social Security account at ssa.gov. Then subtract it, plus any pension, from your expected retirement spending to find your gap.
What savings rate do I need to build real runway?
Each year of work buys savings rate ÷ (1 − savings rate) years of your current lifestyle. At 10% that is about 1.3 months of runway per year; at 30% it is about 5.1 months; at 50% it is a full year. Raising the rate works faster than waiting for a raise.
Can a short-term rental close the retirement gap?
It can cover part of your spending, but only if it is run as a business with conservative numbers. In an illustrative case, six units netting $800 a month produce $57,600 a year. Regulation, thin margins, and early labor are real risks, so build a cash cushion before you start.
Where should a high earner start if their runway is short?
Calculate current runway, find your true savings rate, and estimate your retirement gap. Then cut one large fixed cost and build three months of spending in cash before taking on any asset. A free diagnostic call can help you check those numbers.
Sources
Related Reading