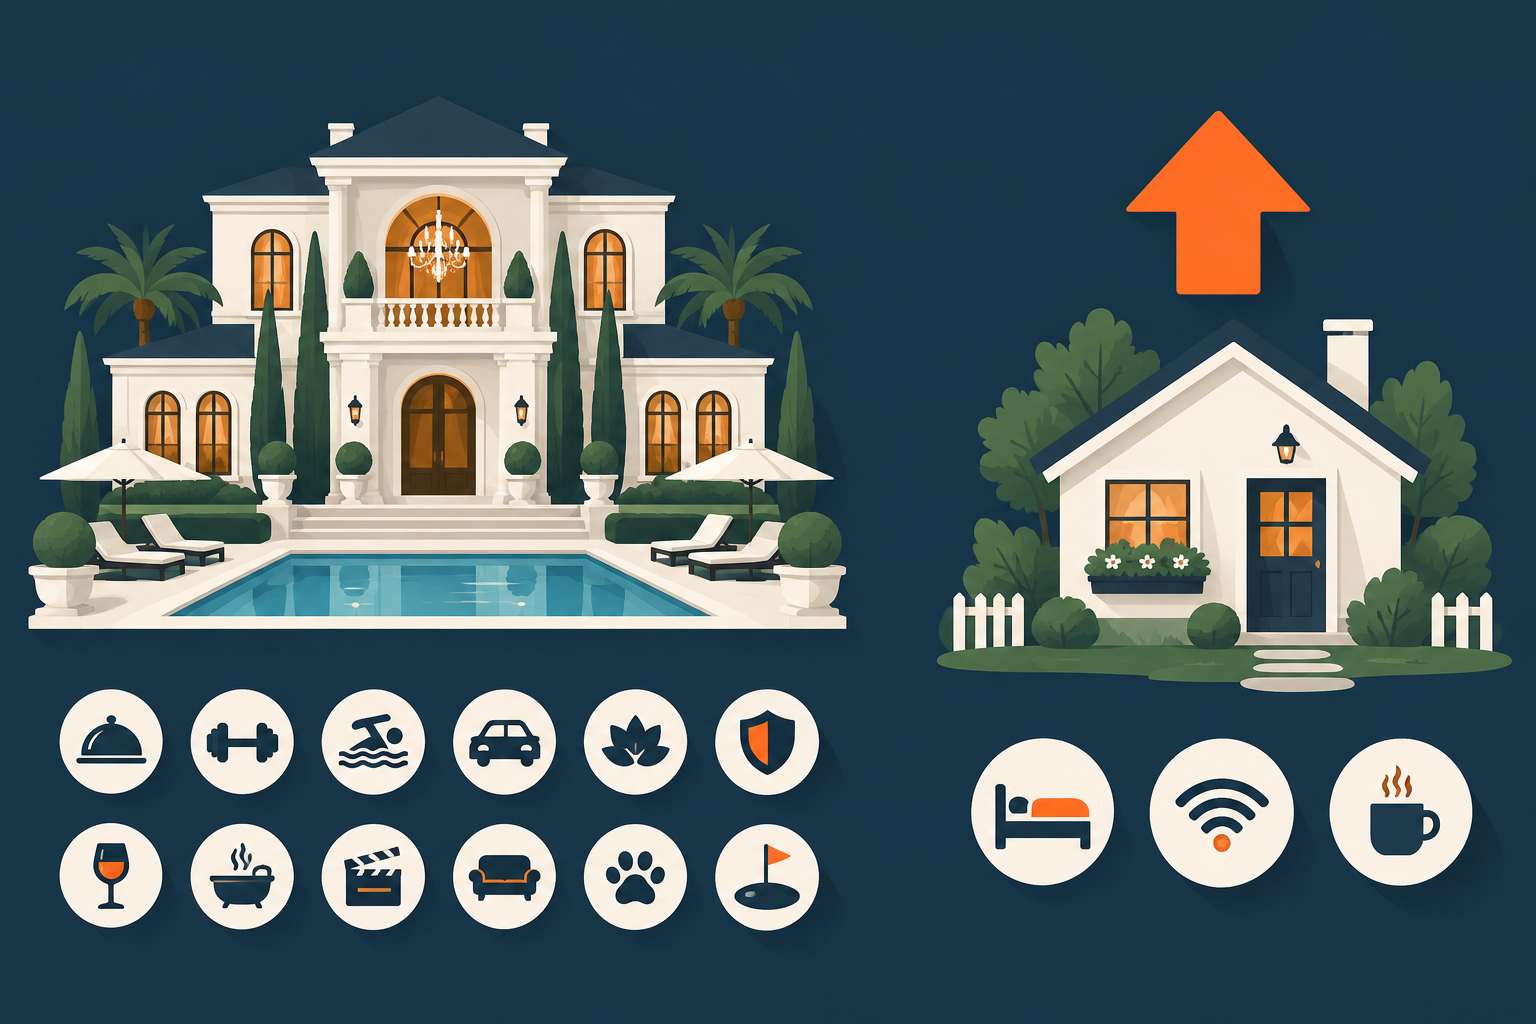
In my illustrative comparison below, a $305,000 mid-market three-bedroom earns a 5.73% yield on total cost, while a $1.19 million luxury five-bedroom at 40.5% occupancy earns 1.85%, even though the luxury unit grosses nearly twice as much. Simple mid-market STRs often out-earn luxury listings because profit depends on yield on the capital you tie up and on fixed costs versus occupancy, not on the nightly rate.
Below is the math, when luxury does work, and the checklist I use before spending on a property.
I have been in real estate for more than 18 years and focused on short-term rentals since 2016. The most expensive mistakes I see from the operators I coach are rarely about bad markets. They are about building a property whose fixed costs need more booked nights than the local demand will supply. Luxury makes that mistake easier to make, because every extra feature adds a monthly bill that shows up whether or not a guest does.
Why Luxury Listings Get Into Trouble
A luxury listing is not a bad idea by itself. The trouble starts when three things stack up at once.
Fixed costs climb faster than revenue. A pool needs a service contract and heating. A hot tub needs chemicals, electricity, and a technician when the pump fails on a Friday. Premium furniture costs more to replace when a guest stains it. Property tax and insurance scale with the purchase price. None of these costs care whether the calendar is full.
The demand pool is narrower. At $650 a night, fewer travelers are shopping. In a market without a real base of high-budget guests, that means longer gaps between bookings, and each empty night costs more because the fixed bills are larger.
Complexity creates more failure points. Every system you add is one more thing that can break mid-stay. Airbnb's own rating categories ask guests whether everything was "in good working condition" under Accuracy, and whether the stay was worth the price under Value. A broken hot tub at a premium price hits both.
The failure mode, put plainly: the owner buys complexity and fixed cost, then discovers the market will not book enough nights to carry it.
Mid-market properties fail too. They just fail more cheaply, and the fixes (a better cleaner, faster messages, sharper pricing) cost hundreds of dollars instead of tens of thousands.
A Worked Comparison: One Luxury Unit vs One Mid-Market Unit
The table below is an illustrative example, not market data. I built it from round numbers in the range I see in operator budgets so the arithmetic is easy to check. Your market will differ, so swap in your own figures and keep the structure.
Assumptions shared by all three columns: property tax at 1% of purchase price, a 15.5% host-only platform fee (the rate Airbnb says most hosts pay under its single-fee structure), and cleaning treated as a host cost per turnover. Gross revenue here is nightly rent only; any cleaning fees you collect from guests are left out to keep the comparison clean. Luxury stays average 4 nights; mid-market stays average 3.
Line (annual, illustrative) | Luxury 5BR, thin demand | Luxury 5BR, deep demand | Mid-market 3BR |
|---|
Purchase price + furnishing | $1,100,000 + $90,000 = $1,190,000 | $1,100,000 + $90,000 = $1,190,000 | $280,000 + $25,000 = $305,000 |
Average nightly rate (ADR) | $650 | $650 | $195 |
Nights booked (occupancy) | 148 (40.5%) | 232 (63.6%) | 252 (69.0%) |
Gross rent | $96,200 | $150,800 | $49,140 |
Platform fee at 15.5% | $14,911 | $23,374 | $7,617 |
Cleaning (turnovers x cost) | 37 x $300 = $11,100 | 58 x $300 = $17,400 | 84 x $110 = $9,240 |
Utilities and internet | $9,000 | $9,000 | $3,600 |
Pool, hot tub, grounds | $7,200 | $7,200 | $1,200 |
Repairs and replacement reserve | $12,000 | $12,000 | $3,000 |
Insurance | $6,000 | $6,000 | $2,400 |
Property tax (1%) | $11,000 | $11,000 | $2,800 |
Supplies and software | $3,000 | $3,000 | $1,800 |
Total operating cost | $74,211 | $88,974 | $31,657 |
Net operating income (NOI) | $21,989 | $61,826 | $17,483 |
NOI yield on total cost | 1.85% | 5.20% | 5.73% |
Gross per bedroom per month | $1,603 | $2,513 | $1,365 |
Three things stand out.
First, the thin-demand luxury unit grosses almost twice what the mid-market unit does ($96,200 vs $49,140) and still produces a yield about one-third as large (1.85% vs 5.73%). Revenue is the wrong scoreboard.
Second, the same luxury house in a market with deep demand works. At 232 booked nights it yields 5.20%, close to the mid-market unit. The property did not change. The demand base did.
Third, Cashflow Diary's benchmark is $800 or more net per bedroom per month. Before debt, only the deep-demand luxury unit clears it (NOI per bedroom per month: $366 thin-demand luxury, $1,030 deep-demand luxury, $486 mid-market). Gross per bedroom ($1,603, $2,513, $1,365) flatters every column. Per-bedroom net is a useful health check for how well a unit is booked and priced, but it says nothing about how much capital you tied up to earn it. Always pair it with yield on total cost.
What Financing Does to the Luxury Math
Most operators do not pay cash. Here is the same math with a mortgage layered on, again illustrative: 25% down and a 30-year loan at 7%.
Luxury loan: $1,100,000 x 75% = $825,000. Monthly payment is about $5,488.75, or $65,865 a year.
Mid-market loan: $280,000 x 75% = $210,000. Monthly payment is about $1,397.14, or $16,766 a year.
Subtract debt service from NOI:
Luxury, thin demand: $21,989 - $65,865 = -$43,876 a year, roughly $3,656 a month out of the owner's pocket.
Luxury, deep demand: $61,826 - $65,865 = -$4,039 a year.
Mid-market: $17,483 - $16,766 = +$717 a year.
This is how luxury operators go broke: a monthly shortfall fed from savings or credit, month after month. The fair reading of the mid-market line is sobering too: at 7% money and 25% down, even the simple unit barely covers its mortgage. Purchase price discipline, a larger down payment, or a better-performing market matters for every property type. The difference is scale: the mid-market unit's cushion is about $60 a month ($717 / 12), while the thin-demand luxury unit's shortfall is more than $3,600 a month.
Cash required also differs. The luxury deal needs $275,000 down plus $90,000 of furnishing, or $365,000. The mid-market deal needs $70,000 down plus $25,000, or $95,000. With the luxury cash you could fund three mid-market deals ($95,000 each, $285,000 total) and still have $80,000 in reserve. Three units also spread the risk: one slow month at one property is a dent, not a crisis. If you are weighing that kind of multi-unit path, my guide on how to scale from 1 to 10 STR properties covers the operating side.
When Luxury Does Work
I do not tell every operator to avoid high-end properties. I tell them to prove demand before they pay for it. Luxury tends to work when these conditions hold:
The market has a real high-budget guest base. Destination ski towns, established beach markets, and large-group event markets can support premium rates for enough nights to cover fixed costs. Check that comparable high-end listings are booked, not just listed.
The amenity is the reason people travel there. A hot tub in a mountain cabin market is often expected. A heated pool in a desert resort area may be the booking decision. In those markets the amenity earns its keep.
You can staff it. Premium properties need vendors who answer the phone on a holiday weekend. If your pool technician takes four days to show up, your reviews will pay for it.
Your break-even is conservative. In the table, the luxury unit's fixed costs of $48,200 need about 102 booked nights just to cover operations. Each night contributes $650 x 84.5% = $549.25 after the platform fee, minus $75 of cleaning ($300 split over a 4-night stay), or $474.25. $48,200 / $474.25 = 101.6 nights. Add the mortgage and the bar rises sharply.
If those conditions are missing, a luxury build is a bet on demand you have not seen yet.
Amenities by Cost vs Guest Impact
Not every upgrade is equal, and Airbnb gives some useful clues about what matters. Its help article on how search results work says the ranking algorithm weighs quality, popularity, price, and location. It also says listings priced below comparable listings with similar characteristics, such as guest capacity and amenities, tend to rank higher. Guests then rate stays on cleanliness, accuracy, check-in, communication, location, and value.
Here is how I sort common amenities, using illustrative cost ranges from the budgets I review. The last column is my judgment, not a platform rule.
Amenity | Illustrative upfront cost | Illustrative yearly carrying cost | Airbnb rating category it touches | My call |
|---|
Fast Wi-Fi with mesh router | $300 | $900 ($75 a month) | Accuracy, Value | Must-have |
Quality mattresses, linens, blackout curtains | $2,500 | $600 in replacements | Cleanliness, Value | Must-have |
Smart lock and a clear check-in guide | $250 | $100 | Check-in | Must-have |
Fully stocked basic kitchen | $800 | $300 | Accuracy, Value | Must-have |
Hot tub | $8,000 | $2,400 (service, chemicals, power) | Value; Accuracy when broken | Only where the market expects it |
Heated pool | $40,000 | $7,200 | Value; Accuracy when broken | Only with proven high-end demand |
Game room or home theater | $6,000 | $600 | Value | Optional; test after occupancy is proven |
Designer décor package | $15,000 | $3,000 in refresh | Listing photos | Skip until the basics are rated 4.8+ |
Add up the four must-haves and you get $3,850 upfront and $1,900 a year. The hot tub alone costs more than twice that upfront. The upgrades that touch every guest's stay are cheap, and the expensive ones only pay where demand already exists. For more on picking upgrades that move bookings, see my breakdown of Airbnb amenities that increase occupancy and ROI.
Premium Experience Without Premium Complexity
None of this means "cheap." A simple property can still deliver a premium experience, and it should. In my premium experience first framework, premium means reliability, spotless cleaning, and fast, clear communication. Those are operating habits, not purchases.
Look at what Airbnb asks for its Superhost badge: a 4.8 or higher overall rating, responses to 90% of new messages within 24 hours, and a cancellation rate under 1%. Not one of those requirements mentions a pool, a theater room, or designer furniture. A three-bedroom with good beds, fast Wi-Fi, a smooth check-in, and an owner who answers messages can meet every one of them.
This is where mid-market operators win. They put their money into the parts of the stay every guest touches:
A cleaner who follows a written checklist and sends photos after each turnover.
A check-in guide with pictures of the door, the lock, and the parking spot.
A message template library so guests get answers in minutes, not hours.
A spare-parts bin: extra remote batteries, a backup router, a second set of linens per bed.
Luxury operators need all of that too, plus the pool contract, the hot tub technician, and the premium furniture reserve. The basics still have to be perfect, and now there are more things to keep perfect.
Unit Economics Checklist Before You Add Anything
Run this process before you buy a high-end property or add an expensive amenity to an existing one. It takes an afternoon and can save you a year of monthly shortfalls.
Price the fixed costs first. List every cost that shows up whether or not a guest books: tax, insurance, utilities, service contracts, reserves, software, and debt service. Write the annual total.
Calculate contribution per night. Take your realistic ADR, subtract the platform fee (15.5% for most hosts on Airbnb's single-fee structure), then subtract cleaning cost divided by average stay length.
Find break-even nights. Divide annual fixed costs by contribution per night (the SBA break-even formula: fixed costs divided by price minus variable cost). Divide the result by 365 to get break-even occupancy.
Check demand against break-even. Pull comparable listings in your price band and look at how booked their calendars are. If comparable units are not clearly above your break-even occupancy, stop.
Compare yield, not revenue. Divide projected NOI by purchase price plus furnishing. Compare that yield across your options, including buying more than one simpler unit.
Test amenities by payback. For any upgrade, estimate the added nights or added rate it needs to pay for itself within 24 months. If you cannot name a comparable listing that proves it, do not buy it yet.
Fix the basics before you add features. If your cleanliness, check-in, or communication ratings sit below 4.8, spend on those first.
Set a decision deadline. Give yourself a fixed window, such as two weeks, to run the numbers and decide. Endless research is its own cost, which I cover in perfect preparation is procrastination.
If you want a second set of eyes on your numbers, book a complimentary one-on-one diagnostic call. We will look at your unit economics together, and if you want a full build-out afterward, the written action plan is $997.
Frequently Asked Questions
Do luxury short-term rentals make more money than mid-market ones?
They usually gross more, but gross is not profit. In the illustrative comparison above, a thin-demand luxury unit grossed $96,200 and yielded 1.85% on total cost, while a mid-market unit grossed $49,140 and yielded 5.73%. The winner depends on local demand and how much capital each property ties up.
When is a luxury STR a good investment?
It can work when the market has a proven base of high-budget guests, when the amenities are the reason people travel there, and when you have reliable vendors to maintain them. Check that comparable high-end listings are actually booked above your break-even occupancy before you buy.
What amenities matter most to guests?
The ones that affect every stay: clean, comfortable beds, fast Wi-Fi, an easy check-in, and a working kitchen. Airbnb guests rate cleanliness, accuracy, check-in, communication, location, and value, and those basics touch most of those categories. Expensive features like pools and hot tubs matter mainly in markets where guests expect them.
How do I calculate break-even occupancy for an STR?
Add up your annual fixed costs, including debt service. Work out contribution per night by subtracting the platform fee and your per-night share of cleaning from ADR. Divide fixed costs by contribution per night to get break-even nights, then divide by 365 to get the occupancy percentage.
Is $800 per bedroom a good target for a short-term rental?
It is Cashflow Diary's own benchmark: $800 or more net per bedroom per month. It does not measure how much capital you invested, so a luxury unit can clear it and still lose money after the mortgage. Use it alongside yield on total cost.
Can a simple property still get five-star reviews?
Yes. Airbnb's Superhost requirements focus on a 4.8 or higher rating, responding to 90% of new messages within 24 hours, and keeping cancellations under 1%. Reliable cleaning, clear check-in instructions, and fast communication earn those ratings without luxury features.
Sources
How search results work — supports the price-versus-comparable-listings and amenities ranking factors cited in Amenities by Cost vs Guest Impact.
Ratings for homes — supports the guest rating categories (cleanliness, accuracy, check-in, communication, location, value) figure in Why Luxury Listings Get Into Trouble and Amenities by Cost vs Guest Impact.
What's required to be a Superhost — supports the 4.8 rating, 90% response, and under-1% cancellation figure in Premium Experience Without Premium Complexity.
Airbnb service fees — supports the 15.5% host-only service fee figure in A Worked Comparison and the Unit Economics Checklist.
Plan your business — supports the break-even formula (fixed costs divided by price minus variable cost) figure in When Luxury Does Work and the Unit Economics Checklist.
Related Reading